Tableau Desktop Professional Edition for Windows – Original – Lifetime
630 Item Sold
Lifetime Activation
For Windows
Comes with activation files
Tableau Desktop Professional Edition: Unlock the Power of Your Data
Are you searching for a powerful, intuitive, and comprehensive tool to transform raw data into actionable insights? What if you could connect to virtually any data source, explore complex information with simple drag-and-drop actions, and create stunning, interactive visualizations that tell a compelling story? With Tableau Desktop Professional Edition for Windows, this level of data mastery isn’t just for data scientists; it’s for anyone driven by curiosity.
This is a digital download that gives you immediate access to the full version of one of the world’s leading analytics platforms. Once you complete your purchase from our trusted store, you will receive an instant delivery of the software and all necessary activation files for a lifetime activation. Stop wrestling with cumbersome spreadsheets and start having a conversation with your data. With Tableau Desktop Professional, you have the ultimate tool to uncover trends, identify opportunities, and make data-driven decisions with confidence.
Why Choose Tableau Desktop Professional Edition?
In a business landscape where data is the new currency, the ability to quickly understand and act on it is a critical competitive advantage. Organizations are flooded with information from countless sources, but without the right tools, it’s just noise. While basic charting tools can provide a surface-level view, they lack the depth, flexibility, and interactive capabilities needed for true exploration. This is where Tableau Desktop Professional Edition shines.
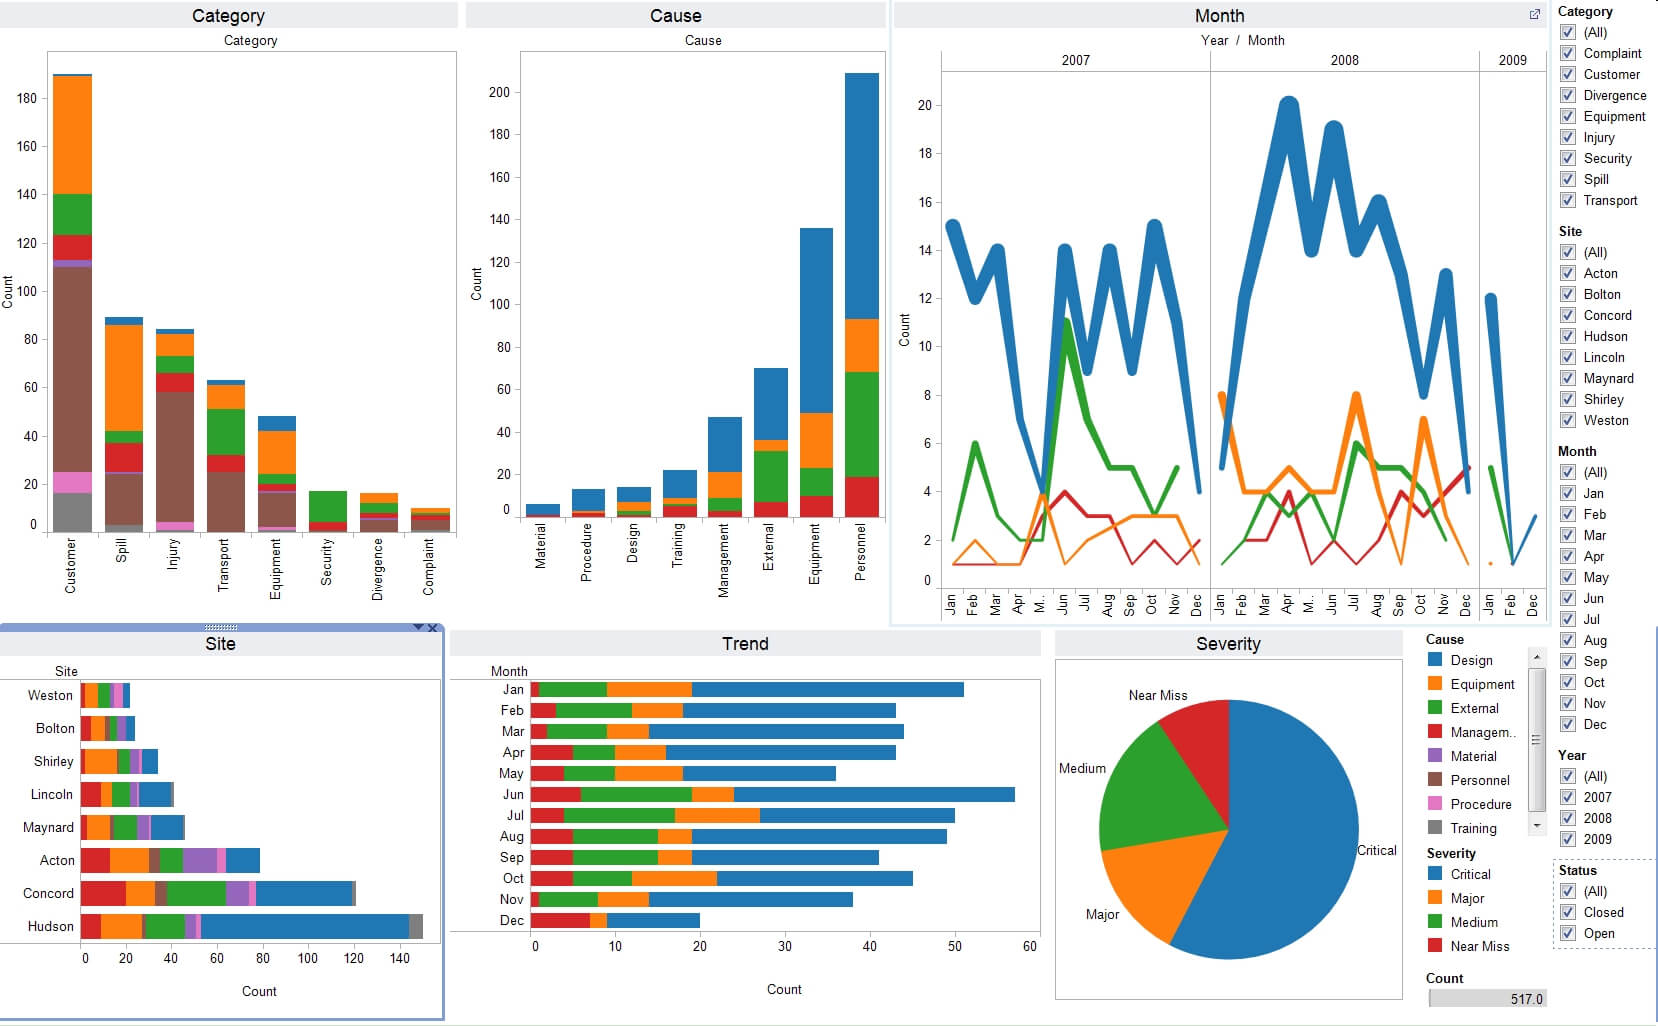
It empowers you to ask deeper questions of your data and find answers you didn’t even know you were looking for. You can create rich, interactive dashboards that allow stakeholders to explore data from their own perspectives, drilling down into specifics or seeing the big picture at a glance. It bridges the gap between complex data analysis and clear, human-understandable communication.
This product comes with a permanent license, meaning it’s a one-time payment for perpetual access to its powerful features. We guarantee that our licenses are original, genuine, and legitimate, providing you with an authentic license for a fully functional, unrestricted product.
Key Features and All Functions of Tableau Desktop Professional
Tableau Desktop Professional is loaded with an extensive suite of features designed to make data analysis faster, easier, and more insightful. Here’s a detailed look at what this industry-leading software offers:
Seamless Connection to All Your Data
One of Tableau’s greatest strengths is its ability to connect to a vast array of data sources, wherever they may live. You are no longer limited to analyzing data from a single spreadsheet or database.
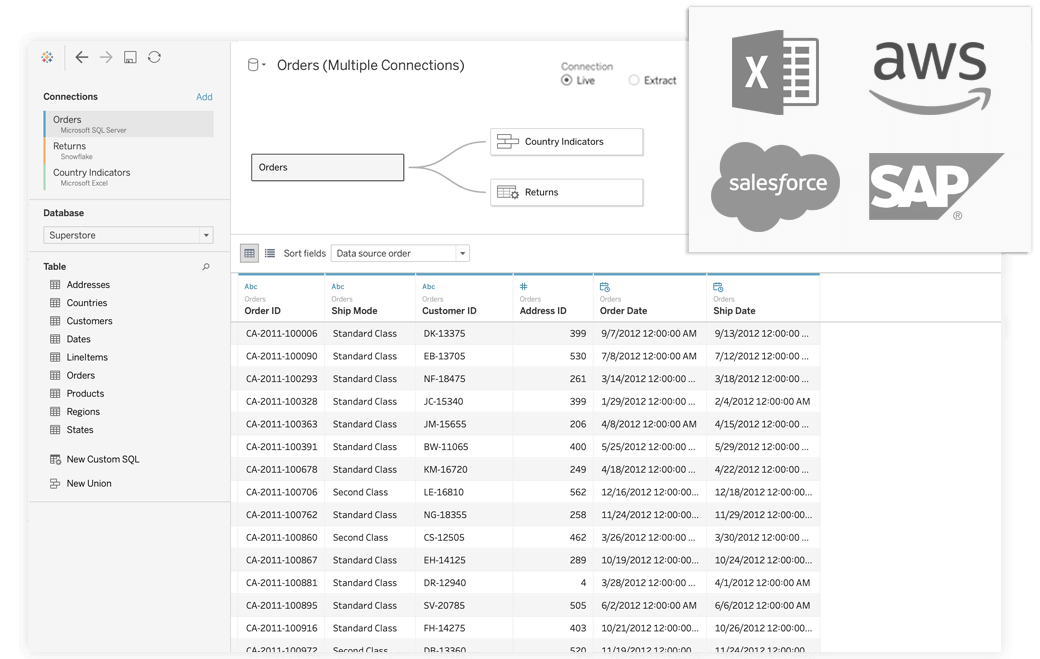
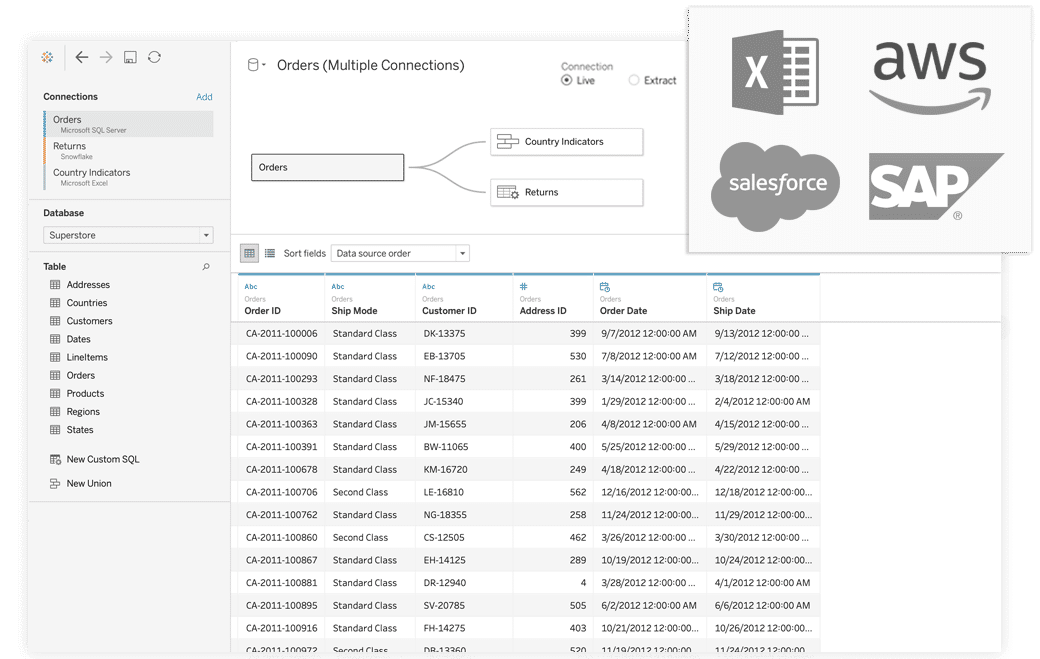
- Connect to Hundreds of Sources: Natively connect to data from sources like Microsoft Excel, SQL Server, Amazon Redshift, Google BigQuery, Salesforce, Oracle, SAP, and many more. Whether your data is on-premises, in the cloud, or in a flat file, Tableau can access it.
- Live and In-Memory Connections: Choose between a live connection to your data for real-time updates or pulling data into Tableau’s high-performance in-memory engine for lightning-fast analysis. This flexibility allows you to optimize for speed or data freshness depending on your needs.
- Data Blending and Joins: Easily combine data from multiple, disparate sources. You can create joins between tables from the same database or blend data from entirely different systems (e.g., blending sales data from a SQL database with marketing data from a Google Sheet) all within the same view.
Intuitive Drag-and-Drop Analytics
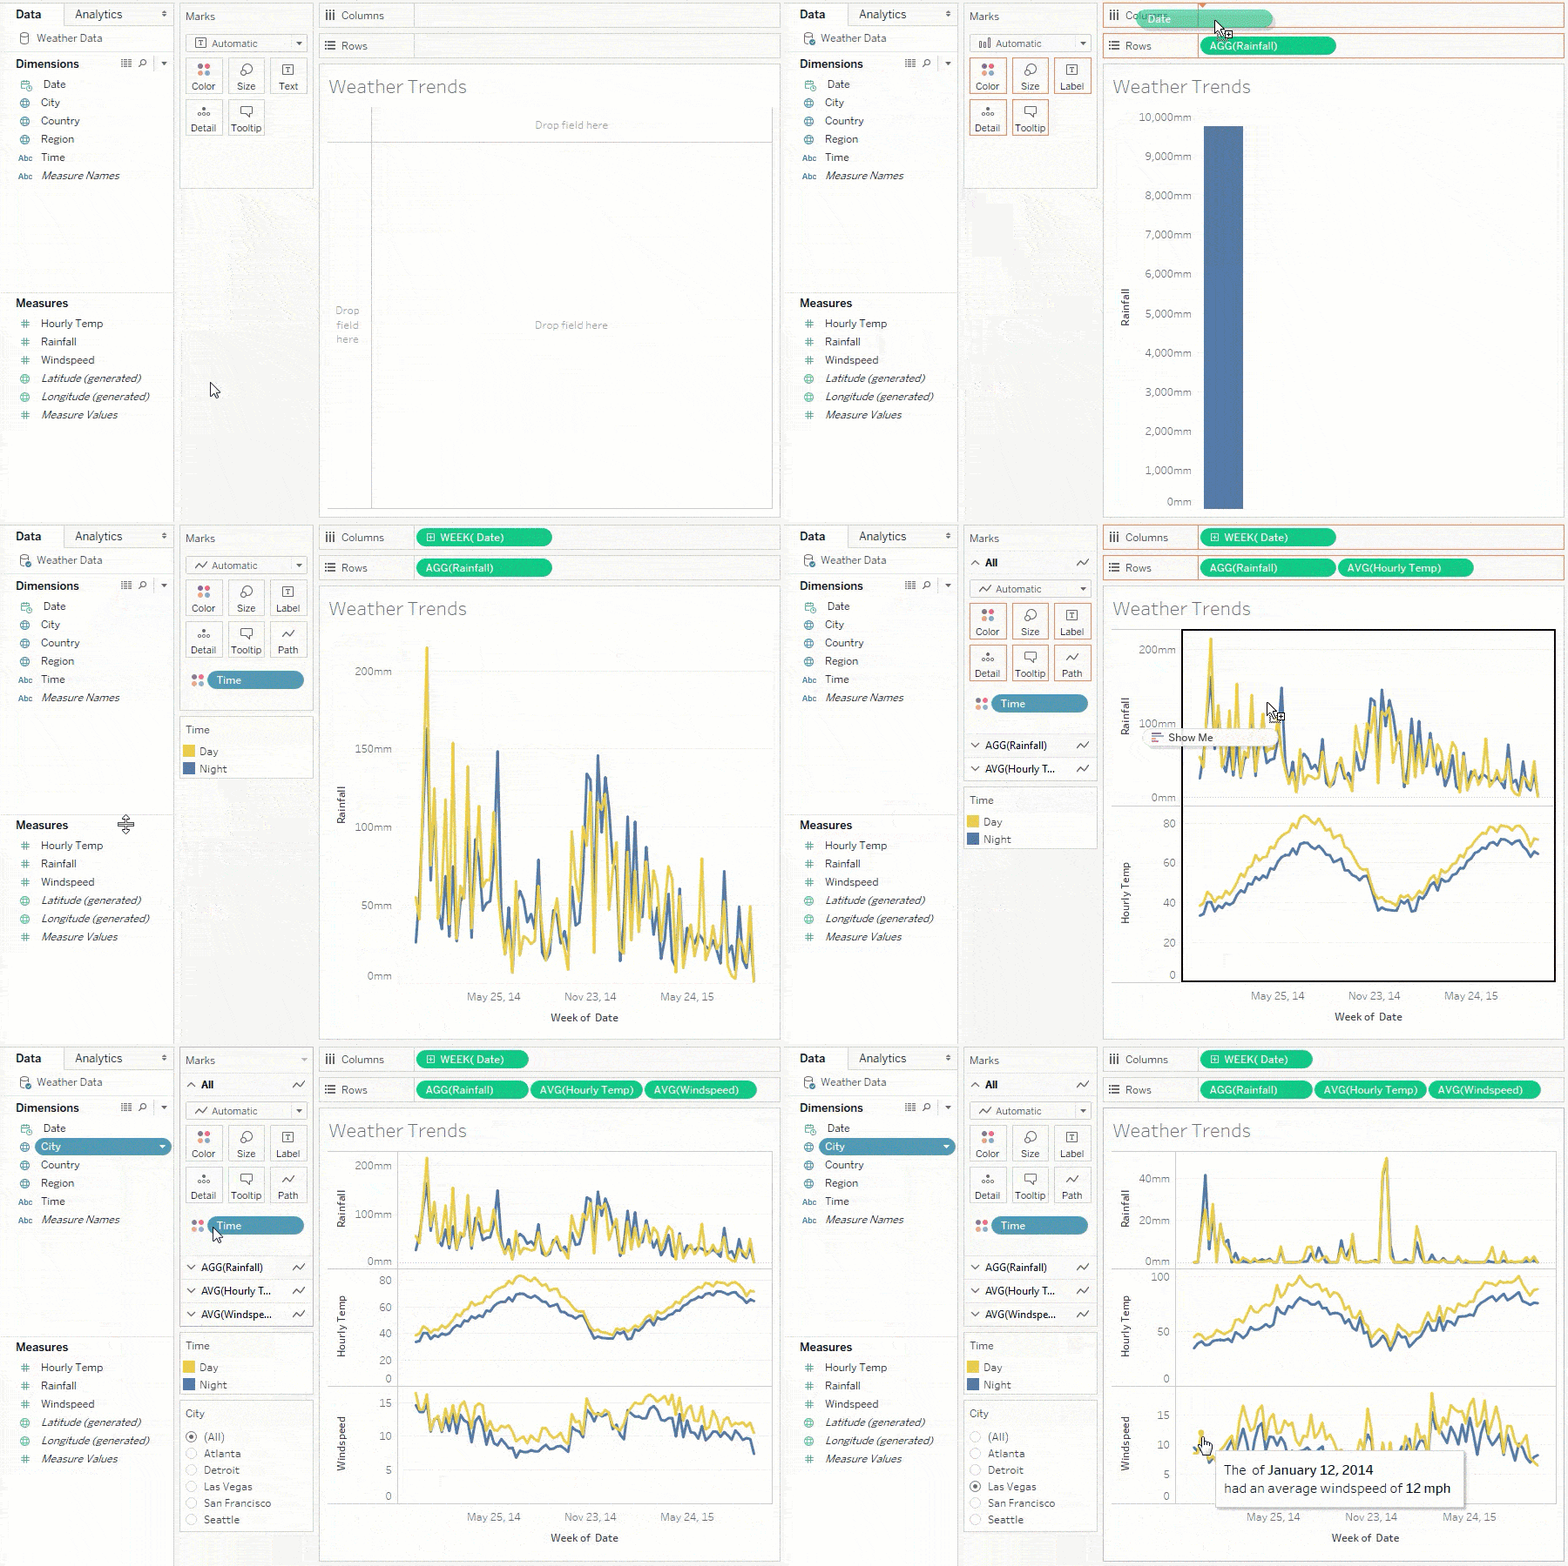
Tableau’s patented Visual Query Language (VizQL) technology is what makes it so revolutionary. It translates your drag-and-drop actions into optimized database queries, allowing you to visualize data and conduct complex analysis without writing a single line of code.
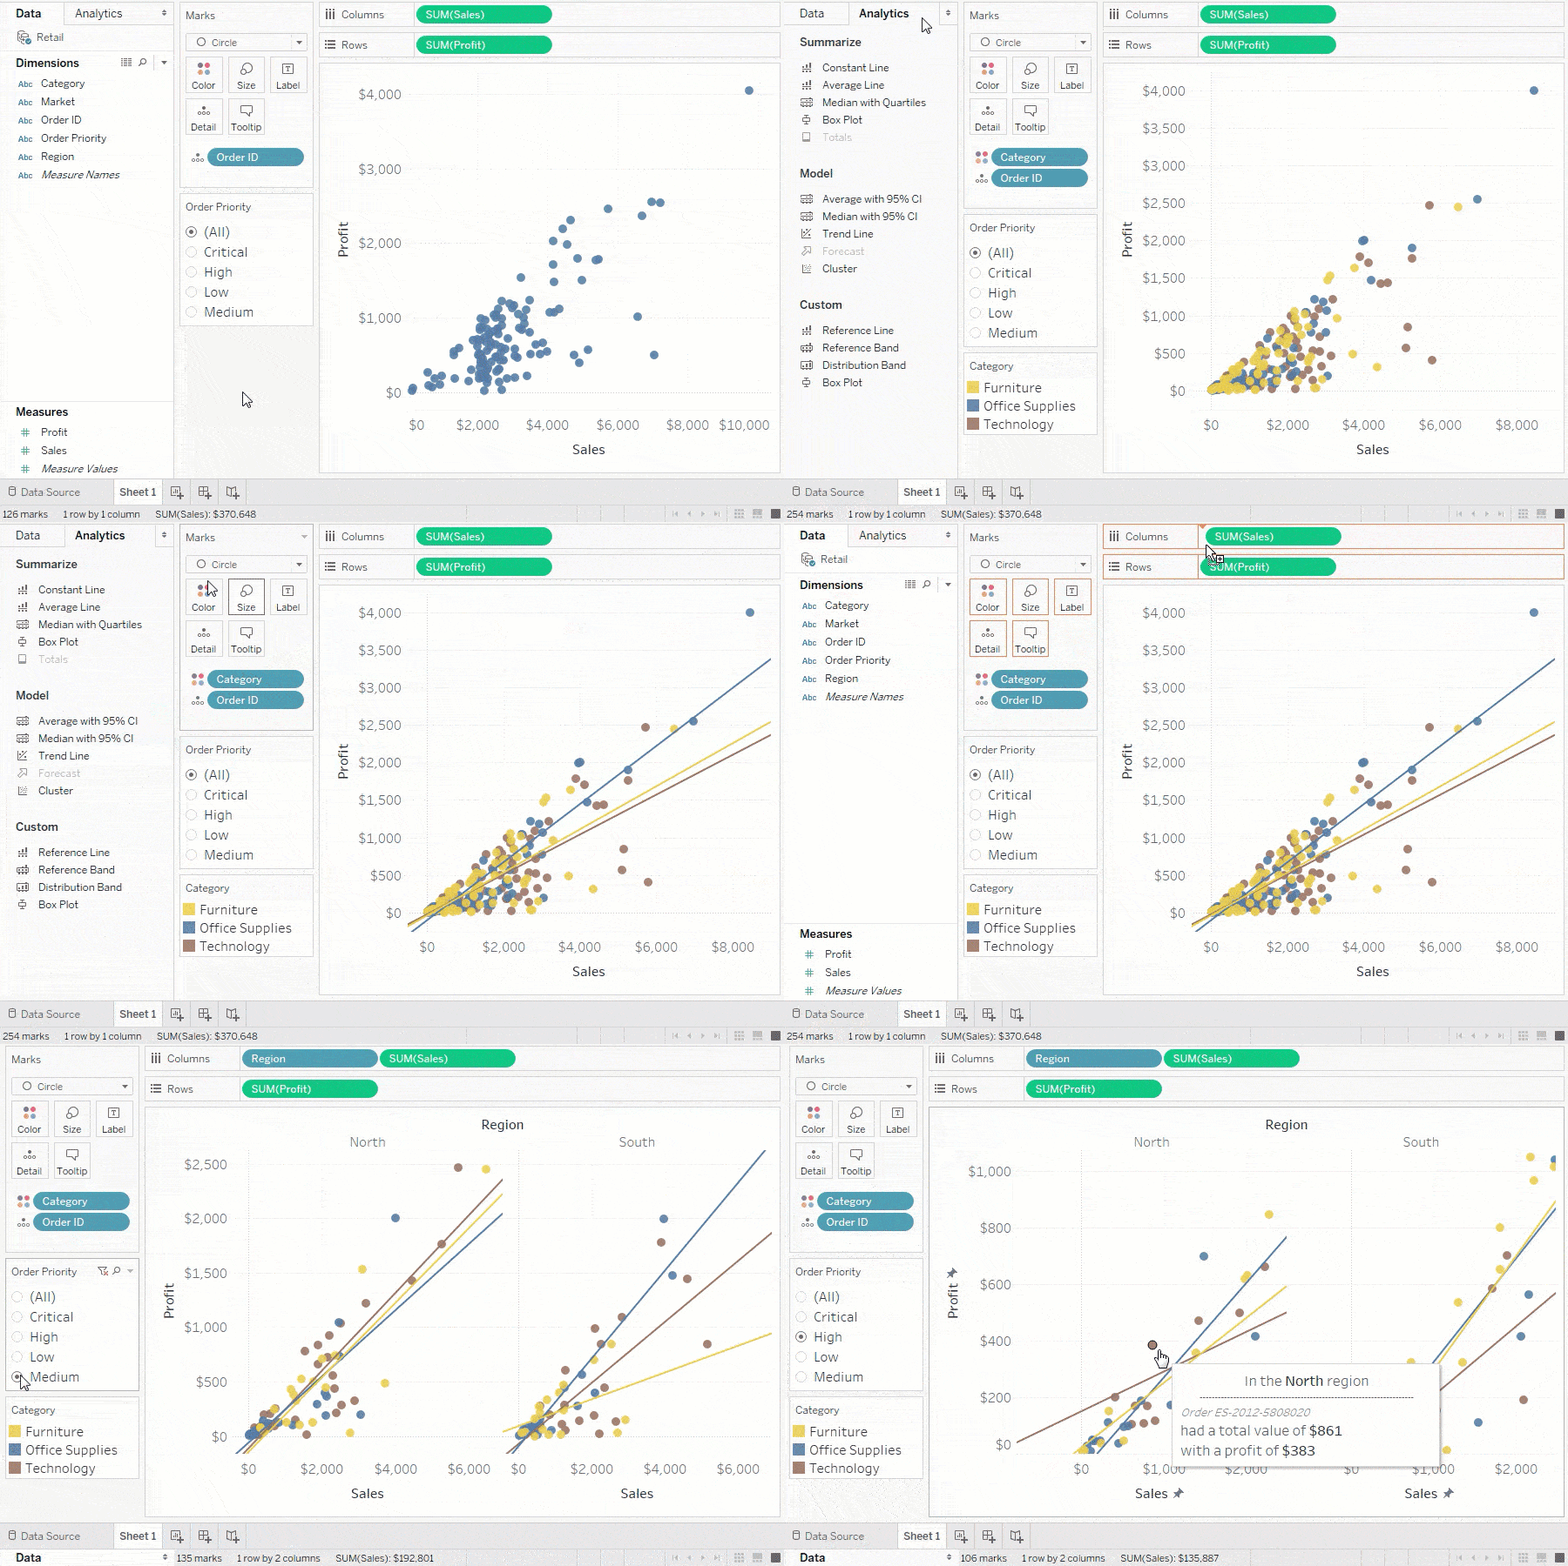
- Visual Exploration: Simply drag data fields onto the “canvas” and Tableau will instantly represent them in the most effective chart type. You can switch between bar charts, line graphs, heat maps, and geographic maps with a single click.
- Unlimited Exploration: Follow your curiosity without hitting dead ends. You can endlessly slice, dice, and pivot your data to uncover hidden patterns and outliers.
- Calculations and Analytics: Go beyond simple visualizations with powerful analytical functions. Create complex calculated fields, add reference lines, build forecasts, and perform statistical analysis like clustering and trend modeling, all with an intuitive interface.
Stunning and Interactive Dashboards
The ultimate goal of data analysis is to share insights. Tableau allows you to combine multiple worksheets, charts, and maps into a single interactive dashboard that can be easily shared with others.
- Dashboard Actions: Create dynamic dashboards where one chart acts as a filter for another. For example, clicking on a region in a map can automatically filter sales data in a corresponding bar chart. This allows users to explore the data for themselves and discover their own insights.
- Device Designer: Design dashboards that look great on any screen. With the Device Designer, you can create optimized layouts for desktops, tablets, and mobile phones, ensuring your audience has a seamless experience no matter how they access your work.
- Story Points: Guide your audience through a narrative with Story Points. This feature allows you to create a sequence of visualizations that walk through your analysis step by step, building a compelling, data-driven story.
Advanced Mapping and Geospatial Analysis
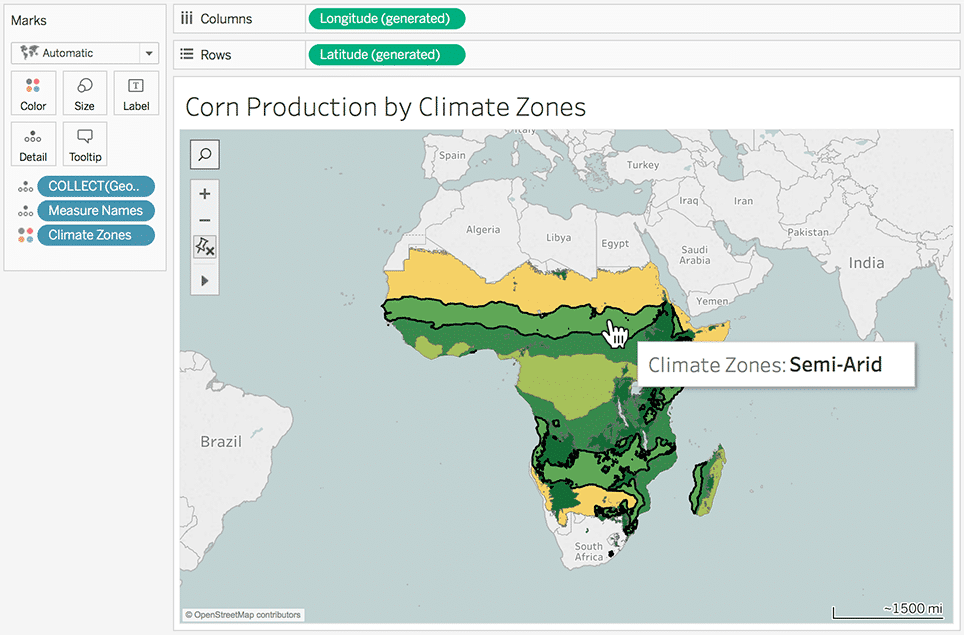
Tableau’s mapping capabilities are second to none. If your data has a location component (like country, state, city, or even latitude/longitude), you can instantly plot it on a map and perform powerful geospatial analysis.
- Built-in Geographic Roles: Tableau automatically recognizes geographic data fields and can create rich, interactive maps without any extra configuration.
- Custom Territories and Layers: Go beyond standard maps by creating custom sales territories, plotting custom delivery routes, or layering multiple types of spatial data onto a single map for deeper context.
- Spatial File Connector: Connect directly to spatial files like Esri Shapefiles, KML, and MapInfo tables to integrate advanced geographic data into your analysis.
How Does It Work? Easy Installation and Activation
We believe that powerful software shouldn’t be complicated to set up. We specialize in providing an easy installation and activation process, backed by our promise of instant delivery and excellent support.
- Purchase Tableau Desktop Professional: Complete your purchase through our secure online payment system. We offer the best price for this premium software.
- Instant Digital Download: Immediately after your purchase, you will receive an email with a secure link to download Tableau Desktop Professional along with the necessary files for Tableau Desktop Professional activation.
- Install the Software: Run the installer and follow the simple on-screen instructions. The software is fully compatible with Windows 10 and 11.
- Activate Your Permanent License: Use the provided files to activate your full version of the software. This is a lifetime activation that will not expire.
- Start Analyzing: Launch Tableau and begin connecting to your data, creating visualizations, and discovering insights.
Should you need any help, we proudly offer free assistance to install and activate the software. Our dedicated support team is here to ensure you can start using your new tool without any frustration.
Why Every Professional Needs Tableau in Their Skill Set
Tableau isn’t just for a niche group of analysts. Its applications span across every department and industry, empowering everyone to make smarter decisions.
- For Marketers: Analyze campaign performance, understand customer behavior, and optimize marketing spend for maximum ROI.
- For Sales Teams: Identify top-performing regions and products, track sales pipelines, and forecast future revenue with greater accuracy.
- For Operations and Supply Chain Managers: Monitor inventory levels, analyze logistics, and identify bottlenecks to improve efficiency and reduce costs.
- For Finance Professionals: Build dynamic financial reports, analyze budget variance, and create detailed financial models.
- For Business Owners and Executives: Get a high-level overview of business health with executive dashboards that consolidate key performance indicators (KPIs) from across the organization.
Purchase with Confidence: Our Unbeatable Guarantees
When you buy online from our store, you receive more than just a product key; you get a commitment to quality, authenticity, and customer satisfaction.
- Best Price and Value: You won’t find a better Tableau Desktop Professional price for a permanent license. This one-time payment model offers incredible long-term value compared to subscription-based alternatives.
- Authentic and Legitimate License: We exclusively sell original, genuine, and legitimate software. Your global license can be used anywhere in the world without restrictions.
- Money-Back Guarantee: Your satisfaction is our priority. We are so confident in our products that we offer a comprehensive money-back guarantee if you encounter any issue that we cannot resolve.
Don’t let valuable insights remain locked away in your data. Empower yourself and your organization to see and understand data like never before. Purchase Tableau Desktop Professional today and take the first step towards a more informed, efficient, and successful future. Click “Add to Cart” to secure your instant digital download and begin your data journey.


